Performance marketing is not just about running campaigns and watching numbers increase. It is about understanding which activities are driving meaningful business results. Metrics such as impressions, clicks, conversions, customer acquisition cost, customer lifetime value, ROI, and ROAS help marketers evaluate every stage of the customer journey.
However, looking at individual metrics in isolation can be misleading. A campaign may generate thousands of clicks but very few conversions, while another campaign may receive less traffic but generate higher revenue. The real value comes from understanding how different metrics connect and what each number tells you about campaign performance.A well-planned performance marketing strategy helps marketers connect these metrics with measurable business objectives
1. Acquisition & Lead Generation
These metrics measure whether your marketing is being seen and whether that visibility is generating leads.
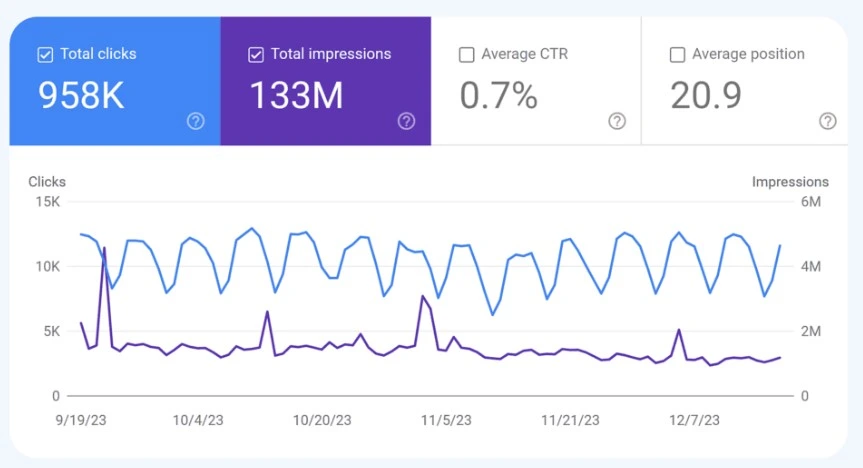
Impressions (Visibility) : The number of times an ad or piece of content is displayed to users.
Clicks (Engagement) : Clicks are the number of times users click on an advertisement, post, link, button, or other clickable element.
In simple words:How many times people interacted with your content by clicking it.
Click-Through Rate (CTR): The percentage of people who saw an ad and clicked on it.
Formula: CTR = (Clicks ÷ Impressions) × 100
Example
A Google Ad gets:
- 10,000 impressions
- 500 clicks
CTR = (500 ÷ 10,000) × 100 = 5%
MQL (Marketing Qualified Lead) :MQL (Marketing Qualified Lead) is a potential customer who has shown enough interest in a company’s product or service to be considered a promising lead by the marketing team.
SQL (Sales Qualified Lead) : A Sales-Qualified Lead (SQL) is a potential customer who has shown strong interest in a product or service and is considered ready for sales follow-up. The lead meets the target customer criteria and has demonstrated a clear intention to make a purchase.
Cost Per Lead (CPL)
is the amount an advertiser pays each time someone clicks on their online advertisement.
The basic formula is:
CPC = Total Advertising Cost ÷ Total Number of Clicks
For example:
- You spend $200 on a campaign.
- Your ad receives 500 clicks.
CPC = $200 ÷ 500 = $0.40
pay 40 cents per click on average.
Impression Share (Search/Competitive)
Impression Share (Search/Competitive) is a Google Ads metric that shows the percentage of times your ad was shown compared with the total number of times it was eligible to be shown.
Simple formula
Impression Share = Actual impressions ÷ Eligible impressions × 100
Example:
Suppose your ad was eligible to appear 1,000 times, but it appeared 700 times.
Impression Share = 700 ÷ 1,000 × 100 = 70%
Impression Share is 70%.
2. Conversion & Efficiency
Once traffic and leads exist, these metrics measure how efficiently that interest turns into action.
Conversions (Desired Actions) : The count of completed target actions — purchases, sign-ups, form fills, or other defined goals.
Example
Suppose you run a Google Ad for a digital marketing course.
1,000 people click your advertisement.
50 people registered for the course.
Those 50 registrations are your conversions.
So:
Clicks = 1,000
Conversions = 50
Click- Someone shows interest.
Conversion – Someone takes the desired action.
Conversion Rate (CVR)
Conversion Rate (CVR) is the percentage of people who complete a desired action after visiting your website, landing page, or seeing your ad.
A conversion could be:
- Making a purchase
- Filling out a form
- Signing up
- Downloading an ebook
- Calling a business
- Registering for a course
Formula
CVR = (Number of conversions ÷ Number of visitors/clicks) × 100
For example:
- 1,000 people click your ad
- 50 people purchase your product
CVR = (50 ÷ 1,000) × 100 = 5%
Conversion Rate is 5%.
Cost Per Acquisition (CPA) : The average cost to acquire one converting customer.
Formula
CPA = Total Advertising Cost ÷ Number of Conversions
For example:
- You spend ₹10,000 on Google Ads.
- You get 100 conversions.
CPA = ₹10,000 ÷ 100 = ₹100
Cost Per Acquisition is ₹100 per conversion.
Cost Per Click (CPC) : The average amount paid for each click on an ad.
Formula
CPC = Total Ad Spend ÷ Total Clicks
Example
Suppose you run a Google Ads campaign:
- Total ad spend: ₹5,000
- Total clicks: 1,000
CPC = ₹5,000 ÷ 1,000 = ₹5
So, your CPC is ₹5 per click.
Simple way to remember
CPC tells you how much you pay to get one click.
Cost Per Mille (CPM) : The cost per 1,000 ad impressions.
Formula
CPM = (Total Ad Spend ÷ Total Impressions) × 1,000
Example
Suppose you spend ₹2,000 on an Instagram advertising campaign and your ad gets 100,000 impressions.
CPM = (₹2,000 ÷ 100,000) × 1,000 = ₹20
So, your CPM is ₹20.
This means you paid ₹20 for every 1,000 times your ad was displayed.
Quality Score (Relevance) Definition: A platform-assigned score (commonly 1–10 on Google Ads) reflecting the relevance of an ad, keyword, and landing page to the user’s search.
Example
Suppose someone searches:
“best walking shoes for women”
Your ad says:
“Best Walking Shoes for Women – Comfortable & Affordable”
And the landing page also focuses specifically on women’s walking shoes.
Google may consider the ad highly relevant and give it a high Quality Score, such as 8/10 or 9/10.
Abandonment Rate : The percentage of users who begin a process (e.g., checkout, form) but leave before completing it.
Formula
Abandonment Rate = (Users who started − Users who completed) ÷ Users who started × 100
Example
Suppose:
- 500 people add a product to their cart.
- 100 people complete the purchase.
- 400 people leave without buying.
Abandonment Rate = (500 − 100) ÷ 500 × 100 = 80%
So, the abandonment rate is 80%.
3. Customer Value & Retention
These metrics shift the focus from a single conversion to the long-term value of a customer relationship.
Customer Lifetime Value (CLV): The total revenue a business can expect from a single customer over the duration of the relationship.
Formula: CLV = Average Purchase Value × Purchase Frequency × Customer Lifespan
A Simple Example
Imagine you run a local coffee shop or an online store:
- A customer spends $10 each time they visit (Average Purchase Value).
- They visit 5 times a year (Purchase Frequency).
- They stay loyal to your shop for 4 years (Customer Lifespan).
10 × 5 = 50 spent each year.
50 × 4 years = $200 total CLV.
Customer Acquisition Cost (CAC) Definition: The average cost to acquire one new customer, including sales and marketing spend.
Formula
CAC = Total Marketing & Sales Cost ÷ Number of New Customers Acquired
Example
Suppose a business spends:
- ₹50,000 on marketing and sales
- Gets 100 new customers
CAC = ₹50,000 ÷ 100 = ₹500
The Customer Acquisition Cost is ₹500 per customer.
LTV to CAC Ratio: A ratio comparing the lifetime value of a customer to the cost of acquiring them; used to judge the sustainability of acquisition spend.
Formula
LTV to CAC Ratio = LTV ÷ CAC
For example:
- LTV = ₹6,000
- CAC = ₹1,500
LTV:CAC = ₹6,000 ÷ ₹1,500 = 4:1
This means:
For every ₹1 spent to acquire a customer, the business generates ₹4 in customer lifetime value.
Customer Retention Rate (CRR) : The percentage of customers retained over a given period.
Formula
Customer Retention Rate = [(Customers at End − New Customers) ÷ Customers at Start] × 100
Example
Suppose:
- Customers at the beginning = 500
- New customers gained = 100
- Customers at the end = 550
Then:
CRR = [(550 − 100) ÷ 500] × 100 = 90%
So, the Customer Retention Rate is 90%.
Customer Churn (Attrition) : The percentage of customers lost over a given period.
Churn Rate
To measure churn as a percentage:
Churn Rate = (Customers Lost ÷ Customers at Start) × 100
In this example:
(100 ÷ 1,000) × 100 = 10%
So, the Customer Churn Rate is 10%.
Repeat Purchase Rate (RPR): The percentage of customers who make more than one purchase.
Formula
RPR = (Customers who made repeat purchases ÷ Total customers) × 100
Example
Suppose an online shoe store has:
- 1,000 total customers
- 250 customers made another purchase
RPR = (250 ÷ 1,000) × 100 = 25%
The Repeat Purchase Rate is 25%
Purchase Frequency: The average number of purchases made by a customer within a given period.
Formula
RPR = (Customers who made repeat purchases ÷ Total customers) × 100
Example
Suppose an online shoe store has:
- 1,000 total customers
- 250 customers made another purchase
RPR = (250 ÷ 1,000) × 100 = 25%
So, the Repeat Purchase Rate is
4. ROI & Financials
This is where marketing activity is translated into financial outcomes.
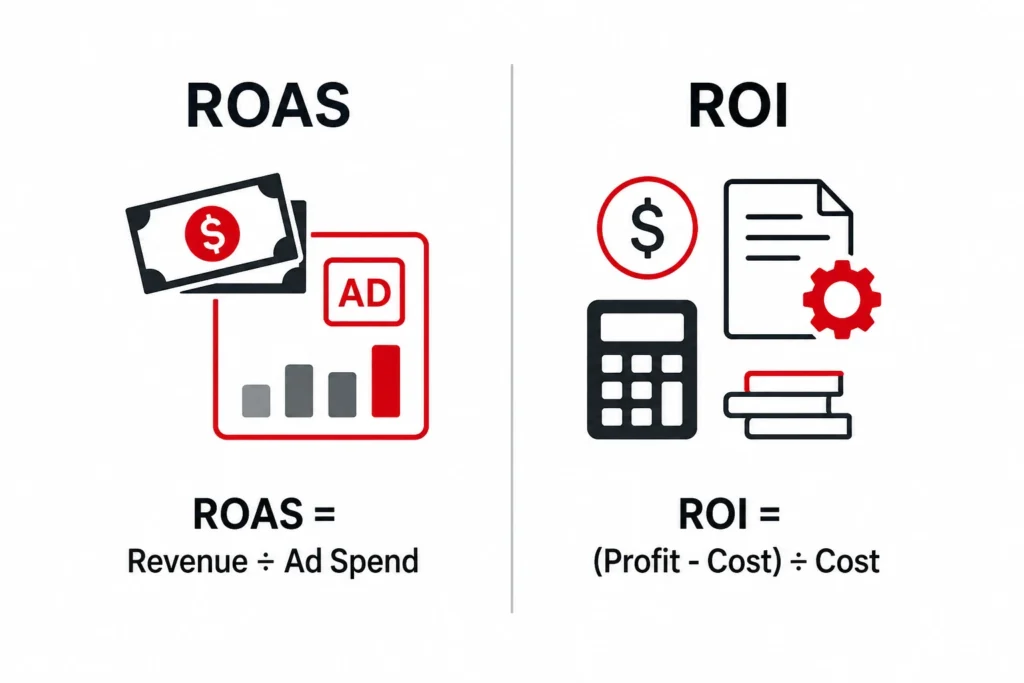
ROI:ROI (Return on Investment) measures how much profit or return you generate compared with how much you invested.
In digital marketing, ROI helps you understand whether your marketing investment was profitable.
Formula
ROI = (Net Profit ÷ Investment) × 100
Example
Suppose you spend ₹10,000 on an advertising campaign.
The campaign generates ₹15,000 in profit.
ROI = (₹15,000 ÷ ₹10,000) × 100 = 150%
Return on Ad Spend (ROAS): ROAS (Return on Ad Spend) measures how much revenue you generate for every ₹1 spent on advertising.
In simple words:
ROAS tells you how much revenue your ads generated compared with the money spent on those ads.
Formula
ROAS = Revenue from Ads ÷ Advertising Cost
Example
- Ad Spend: ₹10,000
- Revenue generated from ads: ₹50,000
ROAS = ₹50,000 ÷ ₹10,000 = 5
ROAS is 5:1.
Conclusion
Measuring marketing performance is not simply about watching numbers increase. The real goal is to understand what those numbers say about customer behavior, campaign efficiency, and business growth.
Metrics such as CTR and CPC help evaluate how effectively campaigns attract attention, while conversion rate and CPA show how efficiently that attention turns into action. Further down the funnel, metrics like CAC, CLV, retention rate, ROI, and ROAS reveal whether those efforts are creating sustainable financial value.
When these metrics are viewed together, marketers can move beyond vanity metrics and make smarter, data-driven decisions. The most effective approach is to choose metrics based on the campaign goal, monitor them consistently, and use the insights to optimize future campaigns.
